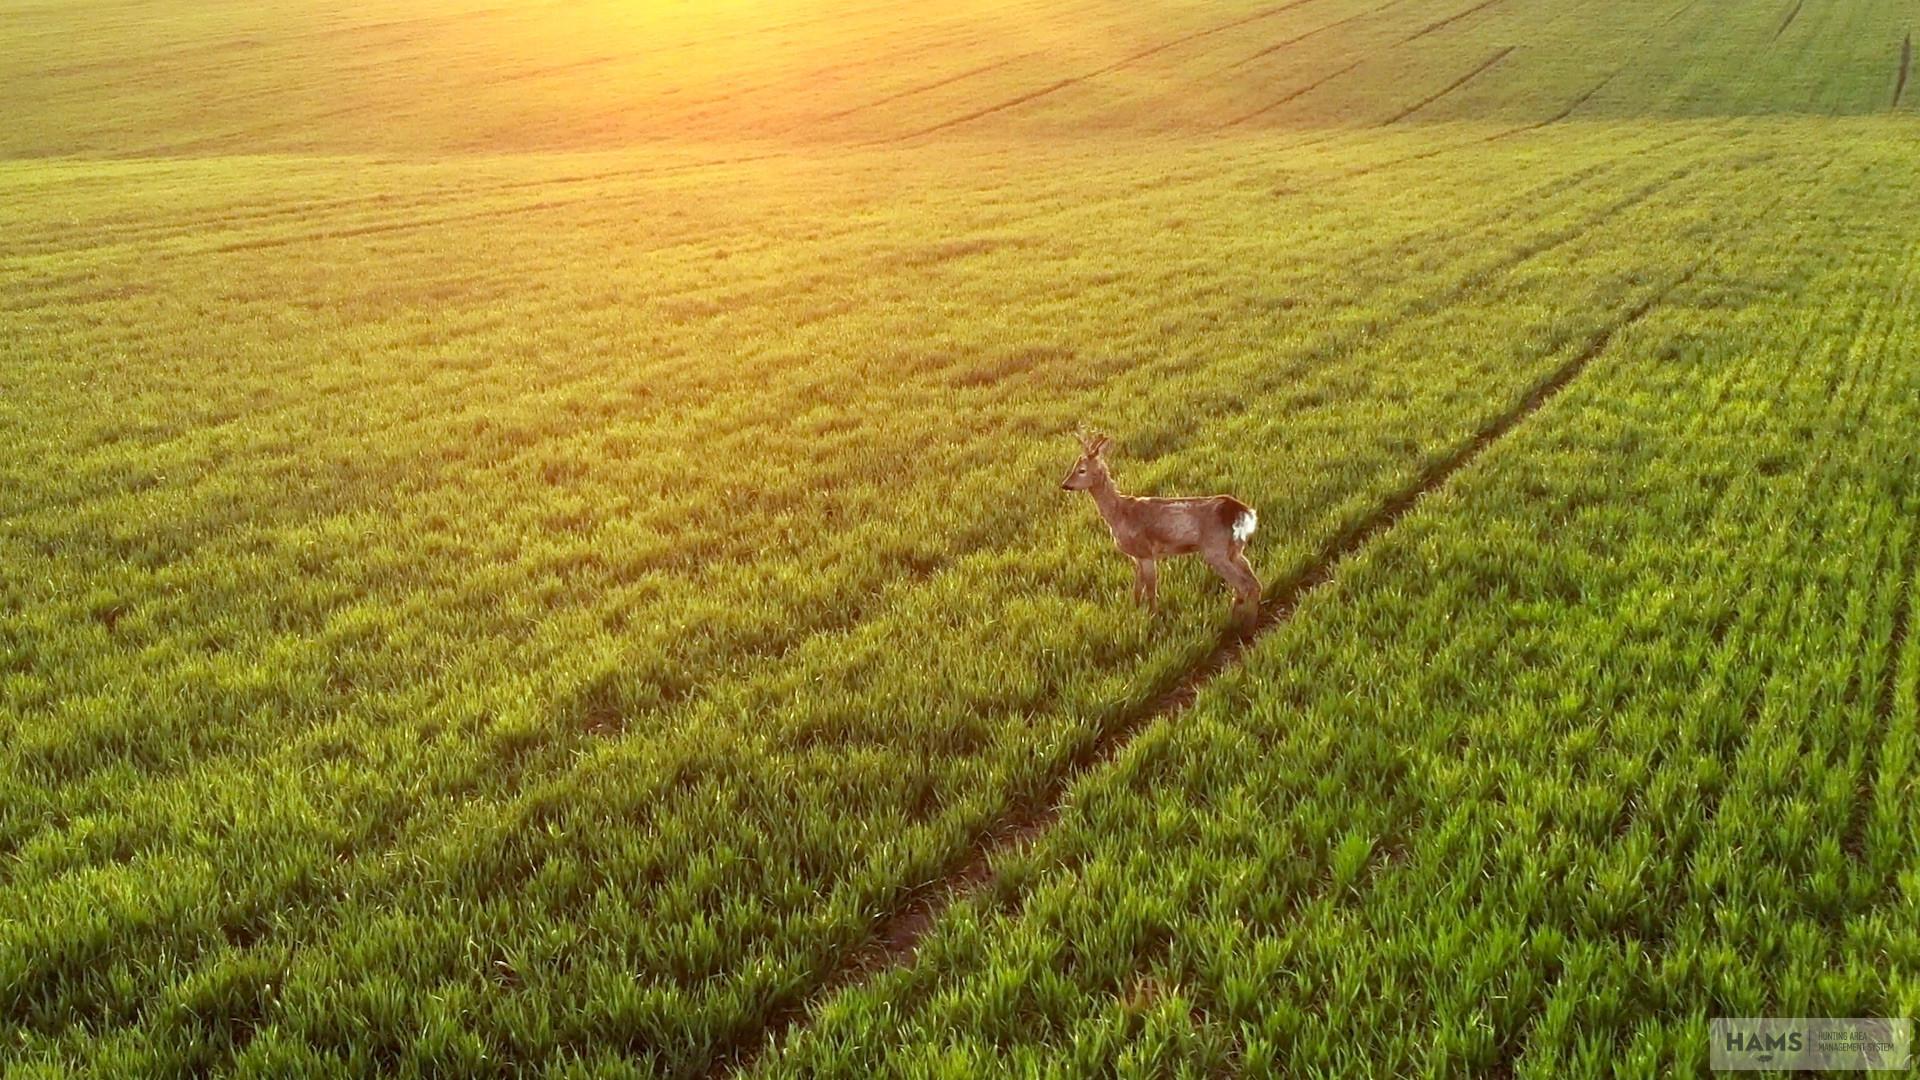
The search for answers: the mysteries of a roe deer population (Part 3.)
In Part 1 of the series, we meet Attila, an experienced keeper who had recently taken over a large estate in Hungary and discuss the challenges he faces in optimizing his deer population.
If you’d like to read PART 1 now, click here
In Part 2 we take a look at the various issues that wildlife managers face and why an online booking and management system can help identify and resolve these.
If you’d like to read PART 2 now, click here
The Detective
As the Miss Marple of this mystery, I would like to introduce myself quickly. My name is Hanna and I graduated from the Szent István University in the faculty of Agricultural and Environmental Sciences in Gödöllő as a Wildlife Management Engineer.
I am currently working on my postgraduate degree, in addition, to assist the development and wildlife specific communication of HAMS.
This is where my story as a detective begins.
Let’s jump straight into science, the facts and the numbers, to have a view of the whole problem.
Then we can ask the necessary questions.
When we want to get the most out of a population we need to create a balance between the following factors:
- Sex-age balance in accordance to our management plans
- Suitable habitat that includes
- enough space,
- cover,
- nutrients,
- water,
- and no disturbance.
Obviously, the above aspects need to be examined one by one to understand their impact on a given population and a change in any one of those factors, or even its absence, has a significant effect on the other factors.
For example, there could be enough water but this is not sufficient if there is not enough space. There could be enough space, but this doesn’t mean anything if there is not enough food or shelter.
Therefore, let’s take a look at the data we have on the above factors!
The Data
One of the foundations of science is that we need to know the accuracy of the data we are working with.
So let’s take a look at the numbers first and examine the trophy weights as this is where this whole story started. Of course, it’s also possible that there is no problem at all and we are just facing a measurement error.
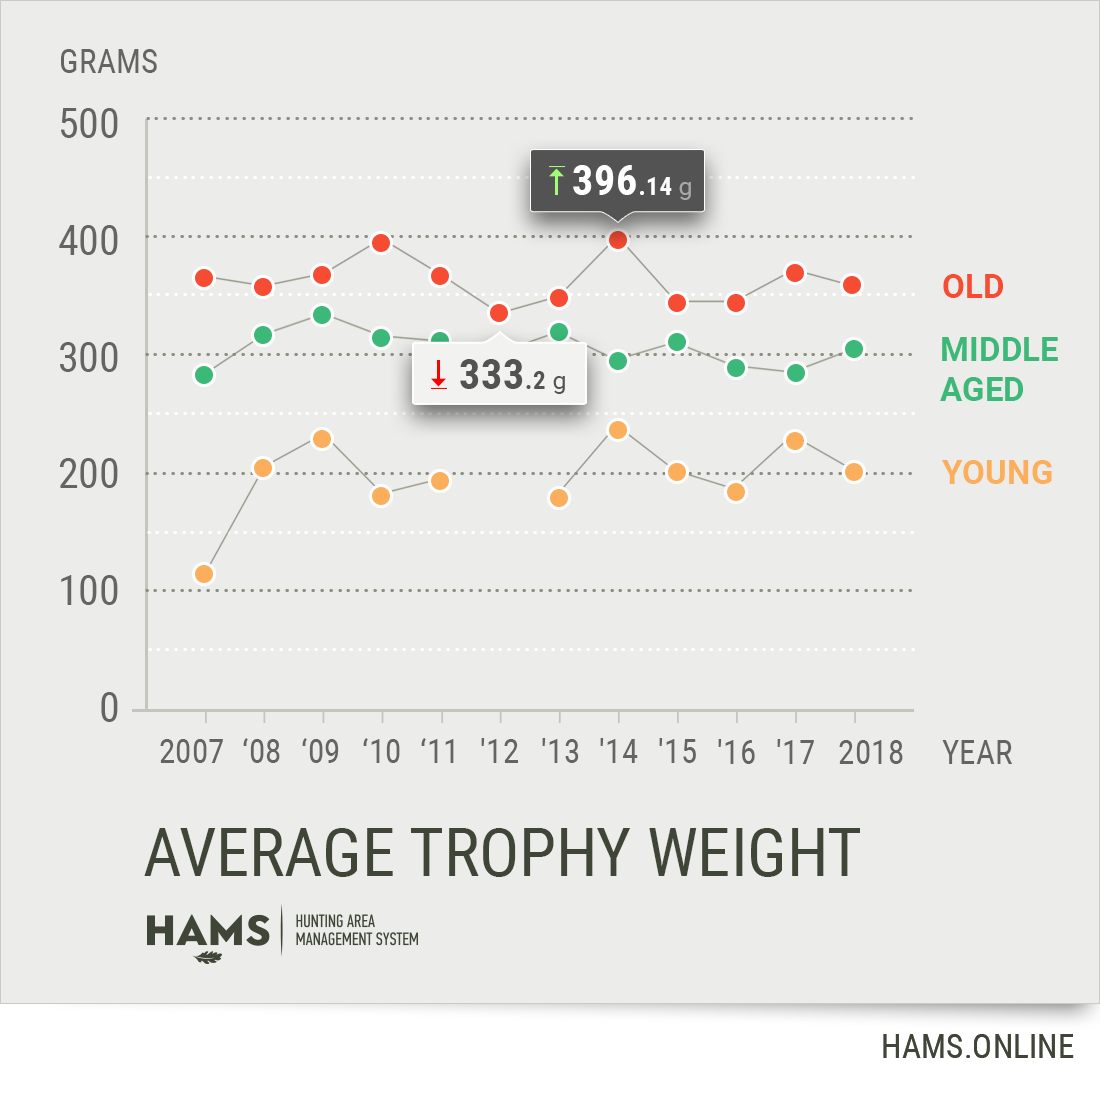
The best trophies were evaluated by the CIC, the official, international trophy evaluation organisation where measurements are based on set standards and human error eliminated, therefore the weights can be taken as accurate.
Additional bio-indicators, such as body weight, are taken by Attila. We assume that he used the same methodology for the measurements taken since 2001. Accordingly, we can assume that if there was a mistake in the measurements, then the same mistake would be present in all of the measurements taken since 2001.
It is clear from the graph that in the case of the older bucks, there has been a large decline in trophy weight since the outstanding 2014.
But what has happened since 2014?
The Population
As I have mentioned previously we need to examine the population size and the balance between the sex and age ratio.
So, let’s start the investigation here.
Attila carries out the population estimates each year. During the winter, some members of the GMU divide the area and start counting the animals they observe. They also use thermal cameras to count the stock that can be seen on the hunting ground. The camera helps in more accurate counting, as it can be done from a distance of up to a kilometre without disturbing the animals.
To carry out population estimations, textbooks suggest doing it during the period from late February to early March. Population estimation can be aided in the future by the integration of HAMS Trail Cameras, as the images received from the cameras pass through automated species recognition technology, HAMS can therefore tell exactly how many animals of which species are in a picture. HAMS then emails a daily summary of this.
Some GMUs use camera traps to monitor populations, which can be another approach.
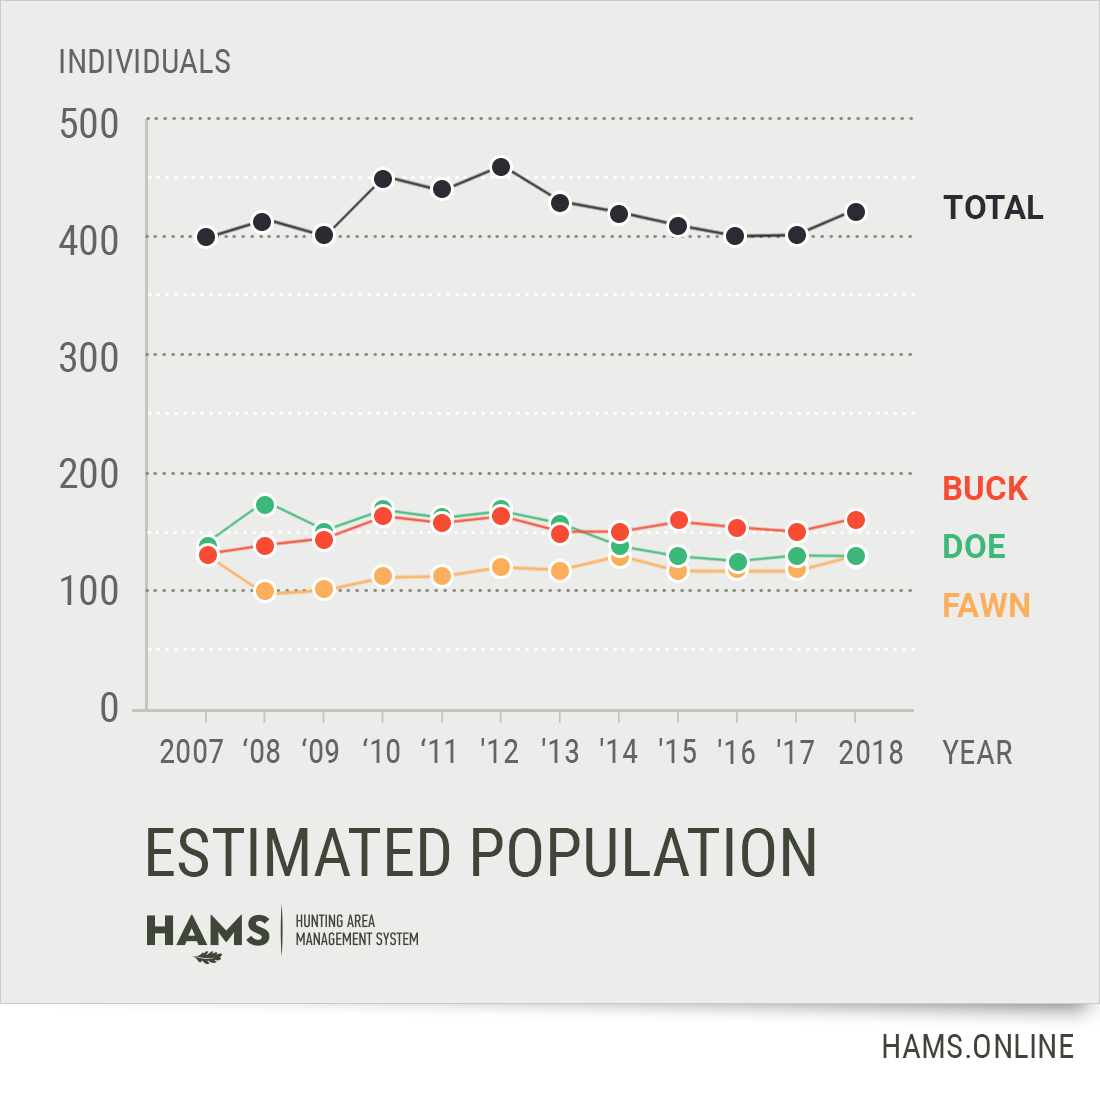
According to Attila’s estimations, in 2007, the population was around 400 individuals increasing to 460 animals in 2012. From then on, there has been a decrease in the population as the harvest increased, which can be seen in the graphs based on the reported data.
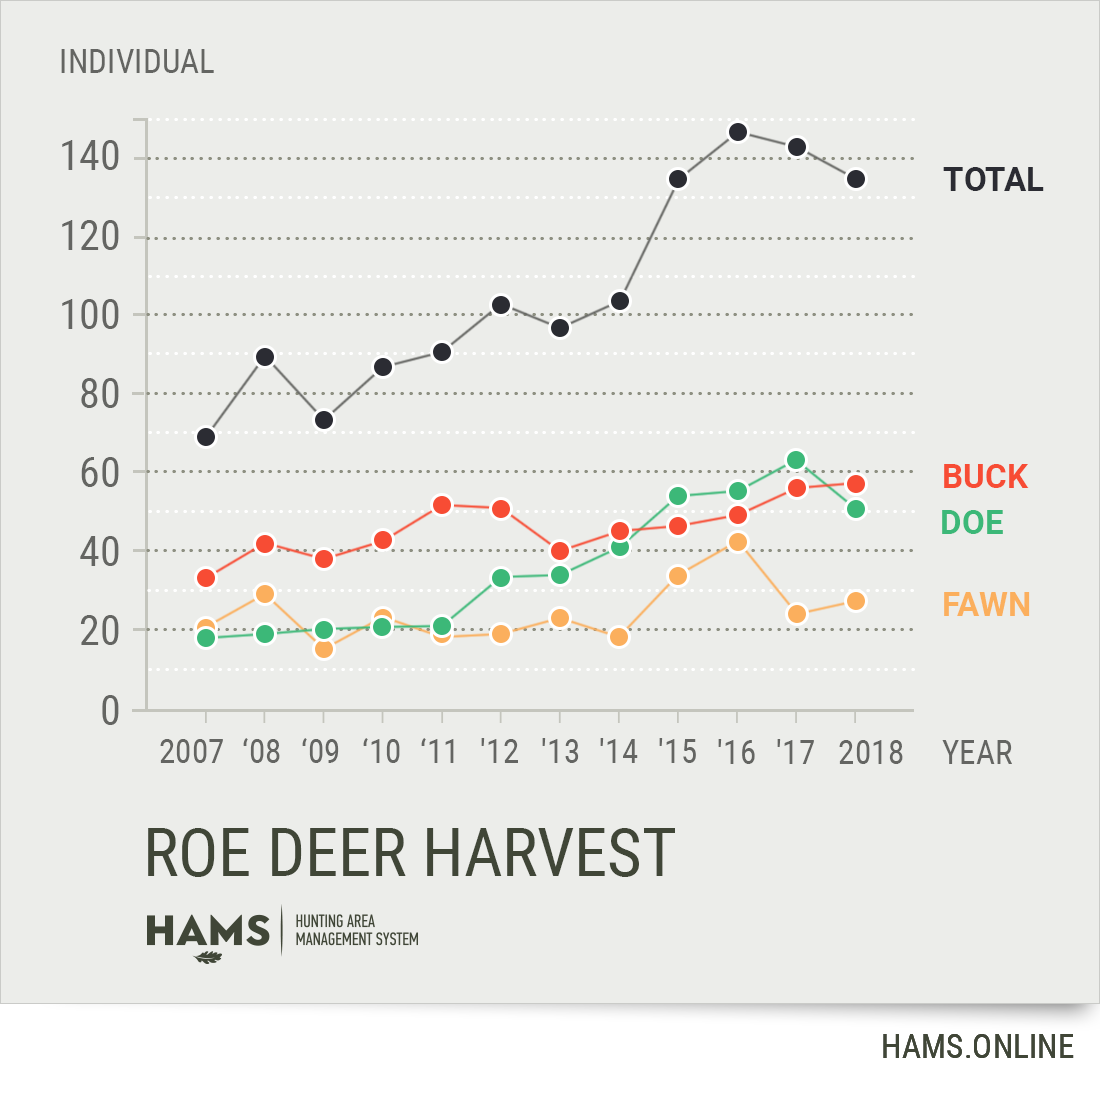
According to the harvest plan, old and sick animals are given priority, particularly if their antlers are deformed and irregular. It may also be worth mentioning that some researchers say irregular antlers are not necessarily hereditary and do not necessarily mean a deterioration in the gene pool.
Additionally, in order for the best genes to be passed on, it’s important to harvest the individuals that have reached their culmination period. In order to keep the reproduction rate at the right level, ⅔ of the does and fawns are harvested according to the plan.
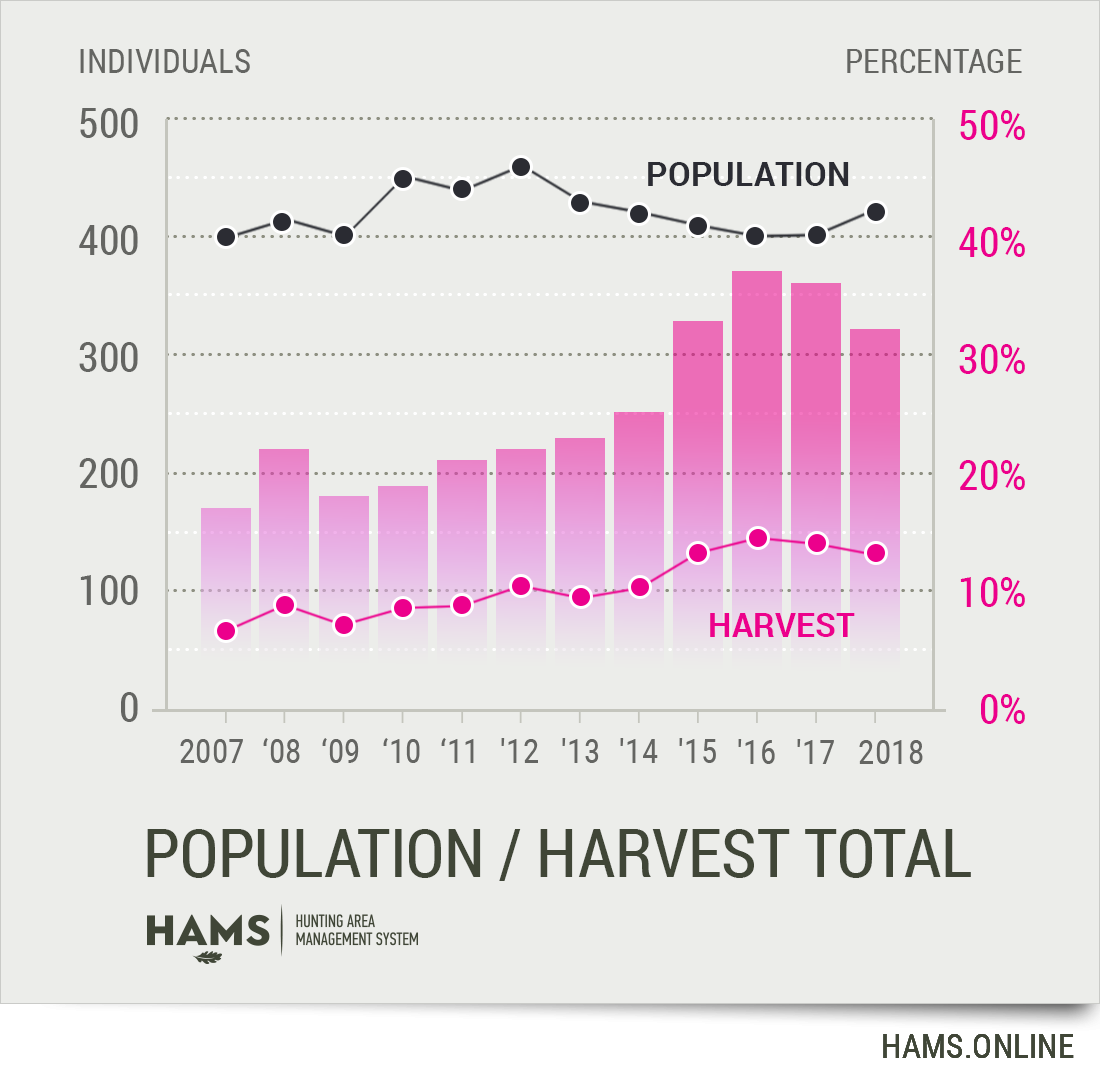
After doing some calculations, it shows that most years the harvest rate was below 25%, which is quite low for roe deer, especially with the high population numbers we’ve seen. However, even with an increased harvest over the years (32-37%), the trophy weight of the old bucks started to decrease.
The Habitat
As mentioned earlier, the habitat consists of four elements: space, cover, food and water. Let’s start with the most important aspect: space.
The required space for each animal is different depending on its body size and individual requirements.
The roe deer is a relatively small deer, weighing around 10-35 kg (22-77 Pound). It has a larger home range in the winter of circa 100-300 ha (cca. 250-740 acres) and a smaller home range of around 30-35 ha (cca. 74-86 acres) in the summer.
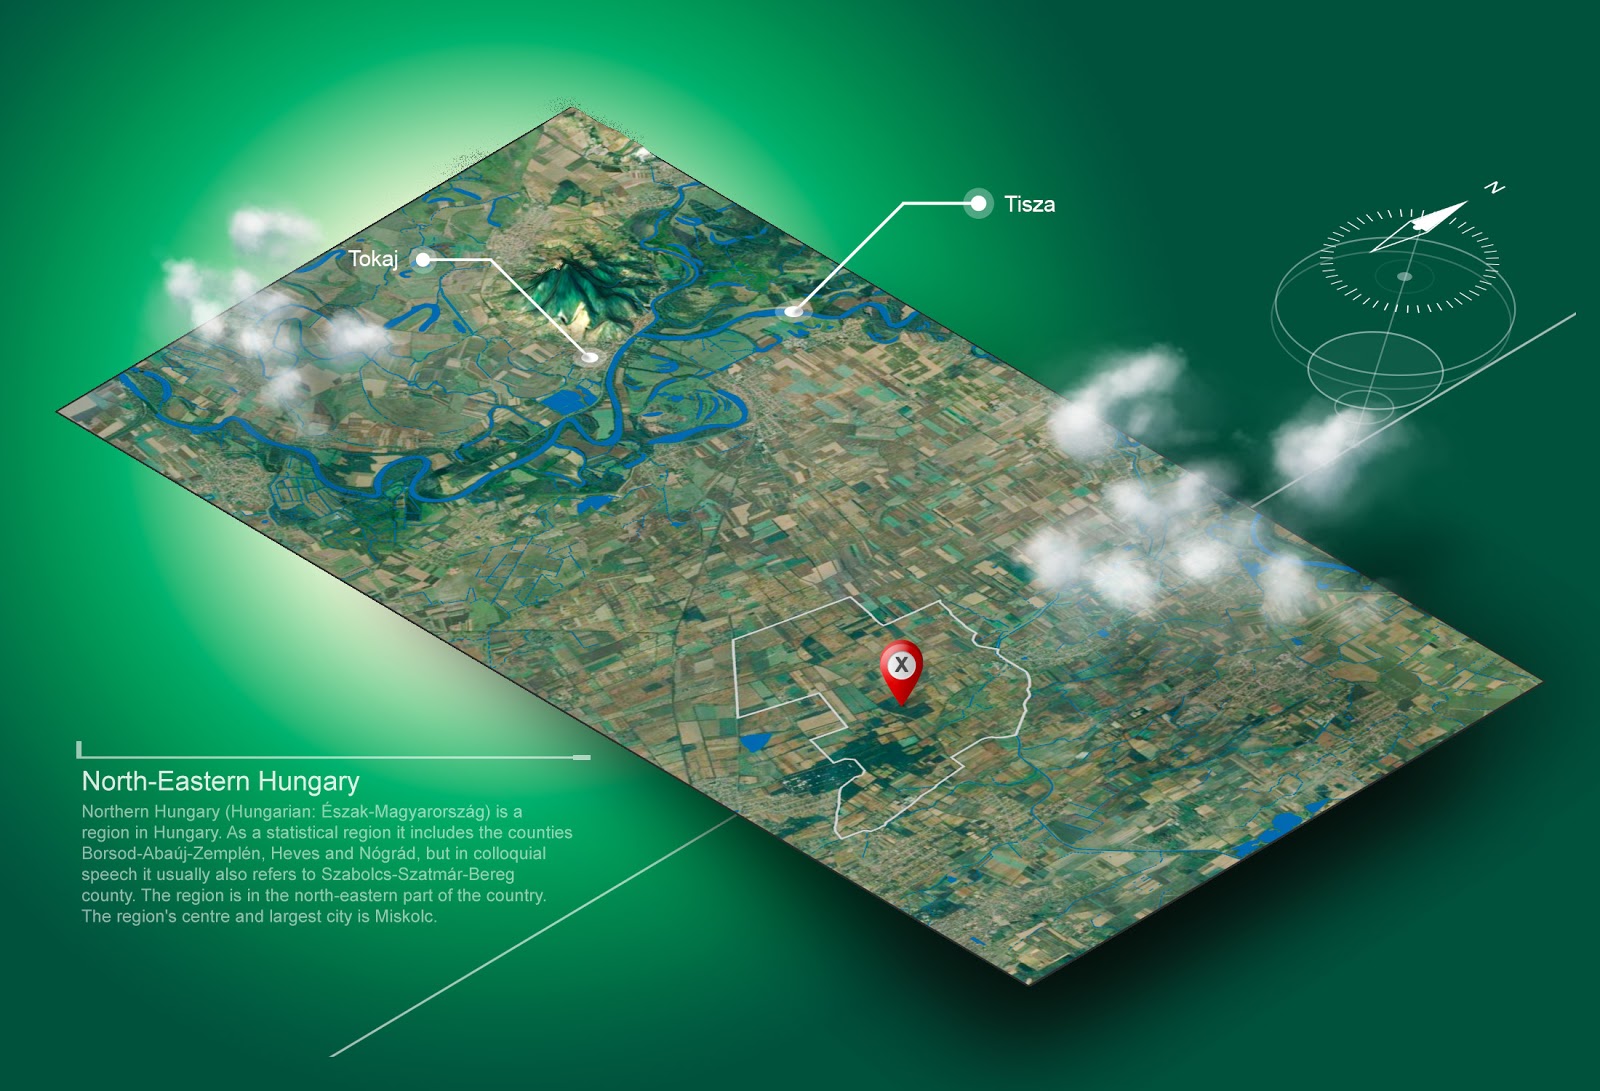
With an area of currently 4,800 ha (11,861 acres), we can quickly calculate that 400 deer (even when we look at the smallest used home range) are too many for the area.
However, because the home range depends on a lot of factors, we cannot just assume that the area is overpopulated. For this, we need to investigate further and study other features of the area.
Food, nutrition, minerals and water
The second most obvious answer would be to look at the quality and quantity of the food. When I asked Attila, he mentioned a whole list of foods provided for the animals:
“We give corn, feed and pieces of apple all-year-round. Minerals in the form of salt blocks are given, as well. Selenium, Vitamin A, macroelements. This has not changed in the last 10 years.”
“What about the natural vegetation?”
“10-12% of the area is forested, these are mainly rows of trees bordering arable land; they’re 8-12 meters wide, 1.5-2.5 kilometres long. We also have semicircular tree rows. I wouldn't call it a forest, but they should provide enough cover for the animals.”
No question, these deer live in a five star hotel with a Michelin star restaurant, but there was one thing yet to be covered - drink.
And here comes something interesting.
Attila assumed the issues he had been facing were possibly related to the available natural water sources, so he contacted the local Water Authority and asked about the precipitation and water level data for the region.
The sad reality was that the available water in the region had been decreasing slowly year on year.
After having taken some measurements, the groundwater level decreased by 210 cm (83 inch) over 8 years. This is a huge difference. Therefore, Attila decided to set up 4 solar water wells to provide the necessary drinking water.
The Lab
The old, fallen, sick grandmother used to appear in the crime scene, who then turns out to be fit as a fiddle and just wants to disguise her identity. So it may be worthwhile us investigating the issue of health as well. After all, sick animals do not have enough energy to build up large antlers year in, year out.
Of course, Attila had already thought about the problem of diseases, so he sent the stomach contents of two individuals to be examined. Laboratory results confirmed that there was no sign of disease.
So, diseases that are responsible for affecting antler growth can also be removed from the list of suspects.
So who did pull the trigger?
The butler? The hunters? Or somebody else? Or is the whole situation just the result of some unfortunate events?
Miss Marple would ask before the secret relationship of the persons on the train (or ship, or the land, in our case) are uncovered. But I’m Hanna, and not Miss Marple, so let me tell you my thoughts about what I have noticed.
Let’s start with a little science first.
As “managers require information on trends in both the animal population and habitat quality in order to interpret changes in the interaction between these two compartments” (Morellet et al., 2007). Therefore, it is essential to look at all sides of the story and investigate all the possible issues in a problematic situation.
When the salt intake of the game is high, they will certainly need to consume even more water than average. Which seems to be a particularly critical issue in a water-scarce area. The problem of water has already been identified by Attila and he has taken the necessary steps to change this situation.
If I had to manage this area, I would probably try to further increase the culling rate.
Visible signs of overpopulation include body weight loss and antler weight loss so I would first try to eliminate overpopulation. This is especially true when we examine how much space this population would need based on “textbook” information.
Although the highest trophy weight averages were achieved 2 years before and after the peak population size in 2012, this contradicts the overpopulation theory.
It is worth mentioning that population estimation methods are usually not accurate enough and are therefore not able to give a true picture of the exact size of the population. In reality, the size can easily be 1.5 times higher than what is observed and estimated.
In the case of population estimations, the regular monitoring of trends is even more important than having exact population numbers. Although having accurate numbers is ideal.
It is also interesting to ask what the management of the surrounding areas is like - there may be a kind of vacuum effect and a declining population will cause some of the population living there to relocate from neighbouring areas due to better living conditions.
Therefore, it is essential to work together with neighbouring managers to develop a common, unified management strategy and concept. (An example of this is already known from Borsod county, Hungary, where 8 Game Management Units started to work together, they shared data, and followed a similar game management strategy)
“But why does Attila want an ideal population?”
Attila knows very well that improving the quality of the population will result in an increase in trophy sizes which also means an increase in revenue.
If we take a closer look at the numbers again and take into account the prices of the harvests, revenue from a trophy of nearly 400 grams could be nearly double than that of a trophy of around 330 grams achieved in the “worst” year.
This is a significant difference in terms of profitability.
Outro
We’ve come this far with our investigation, but it might be interesting to see what our dear readers (see what we did there) think and whether something has escaped our attention.
We would love to read your thoughts on how you would have tried to find out the reason for the decline of trophy weights.
Last but not least, if you are interested in our analysis of the financial aspects of game management, please visit our blog in the next couple of weeks, because we will examine the topic in our newest article.
Sources:
- Morellet, N., Gaillard, J. M., Hewison, A J. M. et al. (2007). Indicators of ecological change: new tools for managing populations of large herbivores. Journal of Applied Ecology 44, 634-43.
- HAMS Hunting Area Management System Database - HAMS.ONLINE
